Ever wondered why your server crashes or your app slows down? A reliable system monitor could be the hero you never knew you needed. Let’s dive into the world of system monitoring—where insight meets control.


What Is a System Monitor and Why It Matters

A system monitor is a software tool or hardware device designed to track, analyze, and report on the performance and health of computer systems, networks, and applications. From CPU usage to memory leaks, a good system monitor provides real-time visibility into what’s happening under the hood.
Core Functions of a System Monitor
The primary role of a system monitor is to ensure optimal performance, prevent downtime, and detect anomalies before they escalate. It continuously gathers data from various system components such as processors, memory, disk usage, network activity, and running processes.
- Real-time performance tracking
- Alert generation for abnormal behavior
- Historical data logging for trend analysis
These functions allow IT teams to respond proactively rather than reactively, minimizing disruptions and maintaining service reliability.
Types of System Monitors
System monitors come in various forms, each tailored to specific environments and needs. Some are built into operating systems, while others are third-party solutions offering advanced analytics.
- Hardware-based monitors: Embedded in servers or network devices, these track physical metrics like temperature and fan speed.
- Software-based monitors: Installed on machines, they track software-level metrics such as memory consumption and process execution times.
- Cloud-based monitors: Offer centralized monitoring across distributed systems, ideal for hybrid or cloud-native infrastructures.
Choosing the right type depends on your infrastructure complexity and monitoring goals.
“Monitoring is not about collecting data—it’s about understanding it.” — Unknown DevOps Engineer
Key Metrics Tracked by a System Monitor
To maintain system health, a system monitor focuses on several critical performance indicators. These metrics provide insights into how efficiently a system is operating and help identify bottlenecks or potential failures.
CPU Usage and Load Average
CPU usage measures the percentage of processing power being used at any given time. High CPU usage over extended periods can indicate inefficient code, background processes, or insufficient hardware resources.
Load average, commonly seen in Unix-like systems, shows the average number of processes waiting for CPU time over 1, 5, and 15 minutes. A consistently high load average suggests system strain.
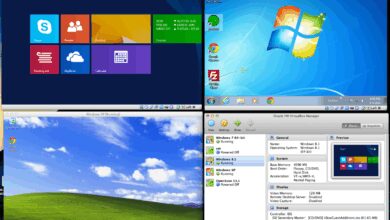
For example, tools like htop provide real-time visualization of CPU usage per core, helping administrators pinpoint resource-hungry processes.
Memory and Swap Utilization
Memory (RAM) usage is another vital metric. When RAM is exhausted, systems begin using swap space—slower disk-based memory—which significantly degrades performance.
A system monitor tracks both physical memory usage and swap activity. Sudden spikes in memory consumption may signal memory leaks in applications or insufficient allocation.
Tools like Netdata offer granular memory tracking, breaking down usage by application, kernel, and cache.
Disk I/O and Storage Health
Disk input/output (I/O) operations measure how quickly data is read from or written to storage. High disk I/O latency can bottleneck entire applications, especially databases.
Modern system monitors also assess storage health using SMART (Self-Monitoring, Analysis, and Reporting Technology) data, predicting drive failures before they occur.
- IOPS (Input/Output Operations Per Second)
- Disk queue length
- Read/write latency
Monitoring these helps prevent data loss and ensures consistent application responsiveness.
Top 7 System Monitor Tools in 2024
With so many options available, choosing the right system monitor can be overwhelming. Here’s a curated list of the most powerful and widely used tools today, each offering unique strengths for different use cases.
1. Nagios XI – The Enterprise Standard
Nagios XI is one of the most established names in system monitoring. Known for its robustness and scalability, it’s a favorite among large enterprises.
- Comprehensive network and server monitoring
- Customizable dashboards and reporting
- Extensive plugin ecosystem
It supports monitoring of cloud services, virtual machines, and physical servers alike. However, its interface can feel dated, and setup requires technical expertise.
Learn more at nagios.com.
2. Zabbix – Open Source Powerhouse
Zabbix stands out for its flexibility and scalability. As an open-source solution, it’s free to use and highly customizable.
- Real-time monitoring with predictive capabilities
- Supports agent-based and agentless monitoring
- Powerful alerting engine with dependency mapping
Zabbix excels in environments with complex infrastructures, including hybrid cloud setups. Its learning curve is steeper than commercial tools, but the payoff in control is significant.
Explore Zabbix at zabbix.com.
3. Datadog – Cloud-Native Excellence
Datadog is a SaaS-based system monitor designed for modern, cloud-first organizations. It integrates seamlessly with AWS, Azure, Google Cloud, Kubernetes, and more.
- Unified observability across logs, metrics, and traces
- AI-powered anomaly detection
- User-friendly interface with drag-and-drop dashboards
While Datadog is premium-priced, its ease of use and deep integrations make it a top choice for DevOps teams managing dynamic environments.
Visit datadoghq.com for a free trial.
4. Prometheus – The DevOps Favorite
Prometheus has become the de facto standard for monitoring containerized applications, especially in Kubernetes environments.
- Pull-based monitoring model
- Powerful query language (PromQL)
- Highly scalable and efficient storage
It’s particularly strong in recording time-series data and enabling real-time alerting. However, it lacks built-in visualization—often paired with Grafana for dashboards.
Get started at prometheus.io.
5. PRTG Network Monitor – All-in-One Simplicity
Developed by Paessler, PRTG offers an intuitive interface and automatic device discovery, making it ideal for中小 businesses.
- Sensor-based monitoring (over 200 types)
- Bandwidth monitoring with traffic analysis
- On-premise or cloud-hosted options
PRTG simplifies complex monitoring tasks with pre-configured templates and real-time maps. The free version allows up to 100 sensors, great for testing.
Check it out at paessler.com/prtg.
6. New Relic – Full-Stack Observability
New Relic provides end-to-end visibility from frontend user experience to backend infrastructure.
- Application performance monitoring (APM)
- Infrastructure monitoring
- User session tracking and error analytics
Its strength lies in correlating user behavior with system performance, helping developers optimize both code and UX. Like Datadog, it’s a paid service with a generous free tier.
Explore New Relic at newrelic.com.
7. Netdata – Real-Time, Zero-Config Monitoring
Netdata is perfect for those who want instant insights without complex setup. It auto-detects system metrics and displays them in a sleek, real-time dashboard.
- Sub-second data collection
- No configuration required
- Lightweight and fast
While it may lack enterprise-grade alerting, Netdata is excellent for developers, sysadmins, and hobbyists who need immediate feedback.
Try it at netdata.cloud.
How to Choose the Right System Monitor
Selecting the best system monitor isn’t just about features—it’s about alignment with your environment, team skills, and long-term goals.
Assess Your Infrastructure Needs
Start by evaluating your current setup. Are you running physical servers, virtual machines, containers, or cloud instances? Each environment has different monitoring demands.
- Physical servers: Focus on hardware health and local resource usage.
- Virtualized environments: Monitor VM performance and hypervisor load.
- Cloud platforms: Prioritize integration with cloud APIs and auto-scaling awareness.
- Containerized apps: Require tools like Prometheus or Datadog that understand ephemeral workloads.
A mismatch here can lead to blind spots or unnecessary complexity.
Evaluate Scalability and Integration
As your infrastructure grows, your system monitor must scale with it. Consider:
- How many nodes or devices will you monitor?
- Does the tool support distributed monitoring?
- Can it integrate with your existing CI/CD, ticketing, or logging systems?
Tools like Zabbix and Prometheus are highly scalable but require more setup. SaaS solutions like Datadog scale effortlessly but come at a cost.
Consider Usability and Learning Curve
Even the most powerful system monitor is useless if your team can’t use it effectively. Evaluate:
- Dashboard clarity and customization
- Alert management and notification channels (email, Slack, SMS)
- Documentation quality and community support
For small teams, PRTG or Netdata offer low barriers to entry. Larger DevOps teams might prefer the depth of Prometheus or Datadog.
Best Practices for Effective System Monitoring
Deploying a system monitor is just the beginning. To get the most value, follow these proven best practices.
Define Clear Monitoring Objectives
Before installing any tool, ask: What do you want to achieve? Common goals include:
- Reducing mean time to detect (MTTD) incidents
- Improving application uptime
- Optimizing resource utilization
Clear objectives guide tool selection, metric prioritization, and alert configuration.
Set Up Smart Alerts, Not Noise
One of the biggest pitfalls in system monitoring is alert fatigue—too many irrelevant notifications desensitize teams.
Best practices for alerting:
- Use thresholds based on historical baselines, not arbitrary values
- Implement alert deduplication and suppression
- Escalate critical alerts to on-call personnel
For example, instead of alerting on “CPU > 80%”, consider “CPU > 80% for 5 consecutive minutes” to avoid false positives.
Monitor End-to-End User Experience
Internal metrics are important, but they don’t tell the full story. A server might be healthy while users experience slow page loads.
Integrate synthetic monitoring (simulated user journeys) and real-user monitoring (RUM) to capture actual performance from the user’s perspective.
Tools like New Relic and Datadog excel in this area, providing insights into frontend rendering times, API latency, and error rates.
Advanced Features in Modern System Monitor Solutions
Today’s top-tier system monitor tools go beyond basic metrics. They offer intelligent features that transform raw data into actionable insights.
AI-Powered Anomaly Detection
Traditional threshold-based alerts struggle with dynamic environments. AI-driven monitoring uses machine learning to establish behavioral baselines and detect deviations.
For instance, Datadog’s Anomaly Detection learns normal patterns and flags unusual spikes—even if they don’t cross predefined thresholds.
This is especially useful for detecting subtle issues like gradual memory leaks or slow database queries.
Automated Root Cause Analysis
When an incident occurs, time is critical. Advanced system monitors now offer automated root cause analysis (RCA), correlating events across services to identify the source.
For example, if a web server slows down, the tool might trace it back to a failing database query or a misconfigured firewall rule.
This reduces troubleshooting time and improves mean time to resolution (MTTR).
Custom Dashboards and Reporting
One-size-fits-all dashboards rarely meet organizational needs. Modern tools allow deep customization, enabling teams to build views tailored to their roles.
- Executives: High-level uptime and SLA compliance
- DevOps: Real-time service health and deployment impact
- Support teams: User-facing error trends and incident history
Regular reporting also helps in capacity planning and justifying infrastructure investments.
The Future of System Monitoring: Trends to Watch
The landscape of system monitoring is evolving rapidly, driven by cloud computing, AI, and the rise of edge devices.
Shift from Reactive to Predictive Monitoring
Future system monitors won’t just tell you what went wrong—they’ll predict what *could* go wrong.
Using predictive analytics, tools will forecast resource exhaustion, hardware failures, and performance degradation based on historical trends.
For example, a system monitor might warn: “Disk failure likely within 7 days based on SMART data trends.”
Growing Importance of Observability
Observability goes beyond monitoring. It’s about understanding a system’s internal state through its outputs—logs, metrics, and traces.
Modern system monitors are becoming observability platforms, enabling deep debugging of complex, distributed systems.
As microservices and serverless architectures grow, observability will be essential for maintaining reliability.
Edge and IoT Monitoring
With billions of IoT devices and edge computing nodes, monitoring is expanding beyond data centers.
Future system monitors will need to handle decentralized, low-power devices with intermittent connectivity.
Solutions like AWS IoT Core and Azure IoT Hub already offer monitoring capabilities for edge environments, but lightweight, efficient agents will be key.
What is a system monitor used for?
A system monitor is used to track the performance, availability, and health of computer systems, networks, and applications. It helps detect issues like high CPU usage, memory leaks, disk failures, or network outages, enabling proactive maintenance and minimizing downtime.
Which system monitor tool is best for beginners?
For beginners, Netdata and PRTG Network Monitor are excellent choices due to their intuitive interfaces and zero-configuration setup. They provide immediate visibility without requiring deep technical knowledge.
Can a system monitor prevent server crashes?
While a system monitor cannot directly prevent crashes, it can alert administrators to warning signs—such as rising memory usage or disk errors—allowing them to take corrective action before a failure occurs.
Is system monitoring necessary for small businesses?
Yes. Even small businesses benefit from system monitoring to ensure website uptime, protect customer data, and maintain application performance. Tools like Netdata or PRTG offer affordable or free options suitable for smaller teams.
How does AI improve system monitoring?
AI enhances system monitoring by detecting anomalies based on behavioral patterns, reducing false alerts, and enabling predictive maintenance. It can identify subtle performance issues that traditional threshold-based systems might miss.
Choosing the right system monitor is no longer optional—it’s a strategic necessity. Whether you’re managing a single server or a global cloud infrastructure, real-time visibility into system performance empowers faster decisions, improved reliability, and better user experiences. From open-source powerhouses like Zabbix and Prometheus to cloud-native leaders like Datadog and New Relic, the tools are available. The key is to align your monitoring strategy with your technical environment and business goals. As technology evolves, so too must our approach—from reactive alerts to predictive intelligence, the future of system monitoring is not just about watching systems, but understanding them.
Further Reading: